


Knowing more about our readers and online audience can only be a good thing. So, to help us create the best content and to uncover trends and views of interest to schools and providers, we asked readers to complete a new survey.
Through the ‘School Trips & Learning Outside The Classroom Survey 2023’ teachers and educational visits coordinators told us how, what and why.
533 respondents participated and the findings will help to ensure we continue to create the most helpful and relevant content and services.
Getting the latest views and insight is important, as well as understanding where schools and organisations find ideas, advice and contacts. Plus, it can be interesting and beneficial for schools and providers to see trends within the sector.
We also wanted to know where you go for trusted sources of information and how teachers and EVCs discover what’s new.
Got something else to add? Please feel free to do so in the comments section at the bottom of the page.
Here’s what we found out…
There was a good mix of participants.
WE ASKED: What is your role?
| Educational Visits Coordinator | 26.10% |
| Class Teacher | 22.36% |
| Deputy / Assistant Headteacher | 17.66% |
| Head of Year / Department | 16.18% |
| Headteacher | 15.13% |
| Teaching Assistant | 13.97% |
| Other | 2.11%* |
* answers for those selecting ‘other’ included: trips coordinator, LOtC coordinator, cover teacher, educational/pastoral mentor, assistant business manager, learning outside the classroom lead, outdoor adventure education coordinator.
WE ASKED: What type of school or organisation do you work in?
| Academy | 32.69% |
| Independent School | 23.08% |
| Maintained School (Local Authority) | 18.80% |
| Free School | 17.09% |
| Multi-Academy Trust | 7.05% |
| Special School | 1.07% |
| Other | 0.21% |
WE ASKED: What is the educational age range of your school / organisation? (select all that apply)
| Primary (ages 5-11) | 30.77% |
| Secondary (ages 11-16) | 29.70% |
| Sixth Form / College (ages 16-18) | 23.08% |
| Upper (ages 13-16) | 14.53% |
| Middle (ages 9-13) | 14.10% |
| Lower (ages 5-9) | 3.21% |
WE ASKED: What types of school trips and visits does your school run? (select all that apply)
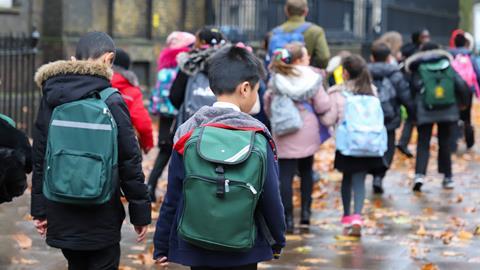
| Local school trips | 92.15% |
| Day trips of more than an hour away | 81.00% |
| Residentials (1 night or more) | 74.62% |
| Overseas trips | 52.02% |

WE ASKED: When your school runs residentials (one night or more), what time of year do you go? (select all that apply)
| Spring | 69.91% |
| Summer | 65.62% |
| Winter | 36.82% |
| Autumn | 35.19% |
| Our school / organisation does not run residentials | 2.36% |
WE ASKED: How far ahead do you plan school trips?
| Type | 3 months or less | 3 months+ | 6 months+ | 12 months+ | 18 months+ | n/a |
|---|---|---|---|---|---|---|
| Local school trips | 34.27% | 24.35% | 21.55% | 8.41% | 2.80% | 8.62% |
| Day trips of more than an hour away | 36.42% | 27.16% | 18.10% | 6.47% | 5.17% | 6.68% |
| Residentials (1 night or more away) | 15.52% | 27.80% | 25.22% | 16.81% | 7.11% | 7.54% |
| Overseas trips | 5.84% | 7.04% | 27.17% | 28.59% | 17.33% | 14.03% |
WE ASKED: How far are you willing to travel for…
| Type | Up to 25 miles | Up to 50 miles | Up to 100 miles | Up to 200 miles | 200 miles+ | n/a |
|---|---|---|---|---|---|---|
| Day trips | 26.51% | 30.39% | 27.37% | 10.78% | 3.66% | 1.29% |
| UK residentials | 12.93% | 23.16% | 29.09% | 20.81% | 9.70% | 4.31% |
WE ASKED: How do you communicate with providers and book your school trips? (select all that apply)
| 79.41% | |
| Phone | 65.48% |
| Website | 26.02% |
WE ASKED: Which subject areas do the trips you run link to? (select all that apply)
| History | 42.81% |
| Geography | 41.45% |
| English | 35.13% |
| STEM | 33.17% |
| Art and Design | 29.39% |
| Science | 28.62% |
| Citizenship | 26.32% |
| Leisure and Tourism | 26.10% |
| Business Studies | 24.34% |
| Design and Technology | 21.93% |
| Dance | 20.83% |
| Media | 19.08% |
| Music | 18.86% |
| Maths | 18.60% |
| Computing | 17.32% |
| Physical Education | 17.32% |
| Modern Foreign Languages | 15.35% |
| Food and Nutrition | 14.25% |
| Drama | 13.16% |
| Religious Education | 10.75% |
| Other | 1.10%* |
* answers for those selecting ‘other’ included: PSHE, team building, life skills, cross-curricular.
WE ASKED: What type of trips are the most popular in your experience? (select up to 3 choices)
| Museums and Galleries | 37.50% |
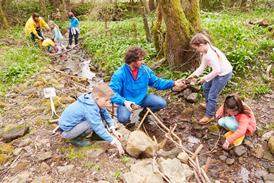
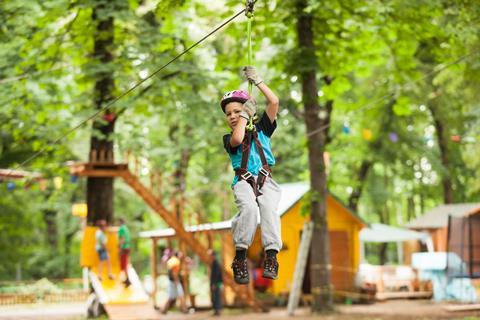
| Adventure and Activity Centres | 32.68% |
| Natural and Outdoor Attractions | 32.24% |
| Residentials | 29.65% |
| Historic Venues | 24.56% |
| Theatre | 22.15% |
| Skiing and Snowsports | 22.15% |
| Sporting Venues | 19.30% |
| Zoos and Wildlife Attractions | 15.57% |
| Theme Parks | 14.91% |
WE ASKED: Do you prefer to visit attractions that provide workshops?
| Yes workshops are important | 76.10% |
| It’s preferable but not essential | 21.49% |
| It doesn’t matter | 2.41% |

Magazines and media habits
WE ASKED: What magazines, websites and media do you use to find ideas, advice and contacts when planning and organising school trips? (select all that apply)
| School Travel Organiser magazine | 77.05% |
| School Travel Organiser website | 70.09% |
| Learning Outside the Classroom Yearbook | 52.29% |
| TES | 20.26% |
| Plan My School Trip | 14.98% |
| Teach Secondary | 14.76% |
| Teach Primary | 6.61% |
| Other | 1.10% |
WE ASKED: What magazine, website or media is your preferred source to find ideas, advice and contacts when planning and organising school trips? (select only one)
| School Travel Organiser magazine | 39.21% |
| School Travel Organiser website | 22.69% |
| Learning Outside the Classroom Yearbook | 20.04% |
| Teach Secondary | 4.85% |
| Teach Primary | 3.96% |
| TES | 3.74% |
| Plan My School Trip | 3.30% |

Awards and Recognition
WE ASKED: We also organise the annual School Travel Awards initiative. If you see that an attraction or provider is a past winner, would that encourage you to visit or use their services?
| Yes it would encourage me more | 94.05% |
| It wouldn’t make any difference | 5.95% |
WE ASKED: Are you aware of the LOtC Quality Badge, developed and managed by the Council for Learning Outside the Classroom?
| Yes | 88.99% |
| No | 11.01% |
WE ASKED: If an attraction or provider has been awarded an LOtC Quality Badge, would it encourage you to visit or use their services more?
| It’s an essential award when choosing attractions and providers | 71.22% |
| It would encourage me more but it is not essential | 28.04% |
| It makes no difference | 0.74% |
The 2023 ‘School Trips & Learning Outside The Classroom’ survey ran between 9th March and 1st May and had 533 respondents. This was a survey for teachers involved in organising school trips and EVCs. Anyone not meeting that criteria, or any ‘spam’ or ‘bots’ were filtered out and not included in the final results.
Our thanks go to everyone who took the time to contribute.


No comments yet